Upstream Intelligence System
How It Started
A major energy corporation needed a centralized, real-time dashboard to monitor all stages of oil and gas extraction - from field operations and equipment status to workforce data.Their existing systems were fragmented and difficult to scale, limiting operational visibility and slowing down decision-making.
The goal was to bring everything into one unified, high-performance BI interface that could support daily operations and long-term strategy.
Goals & Oblectives
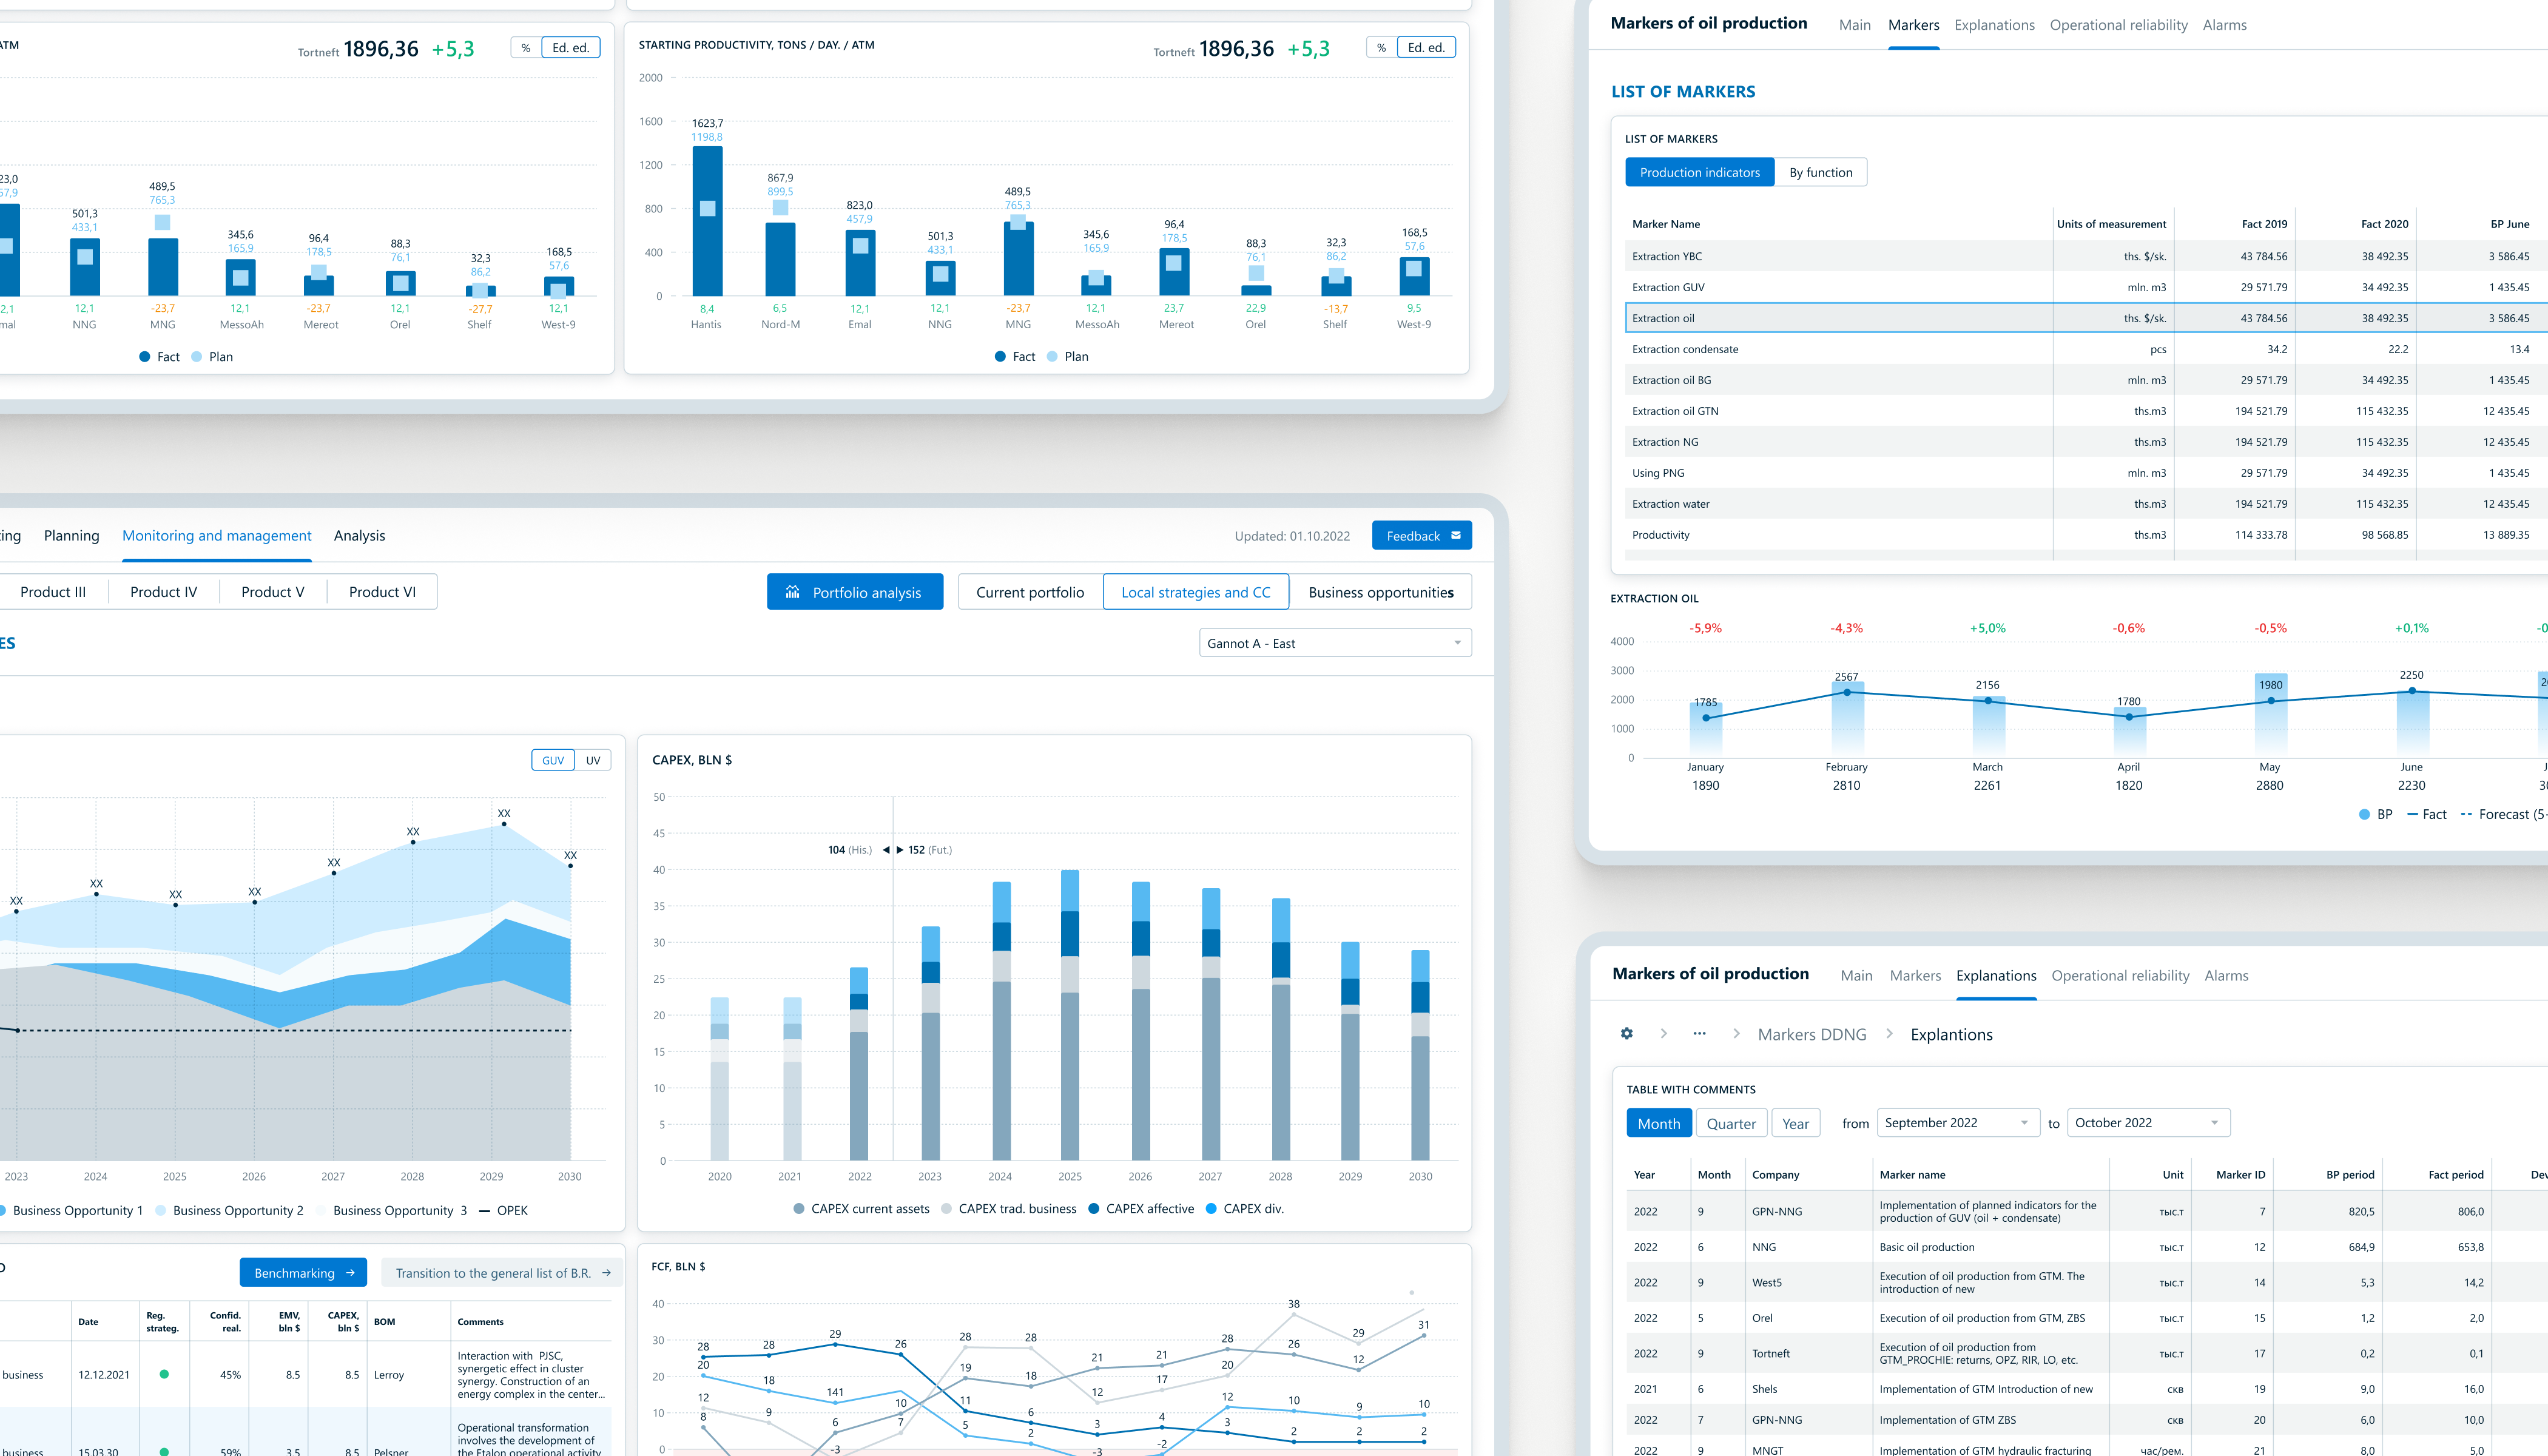
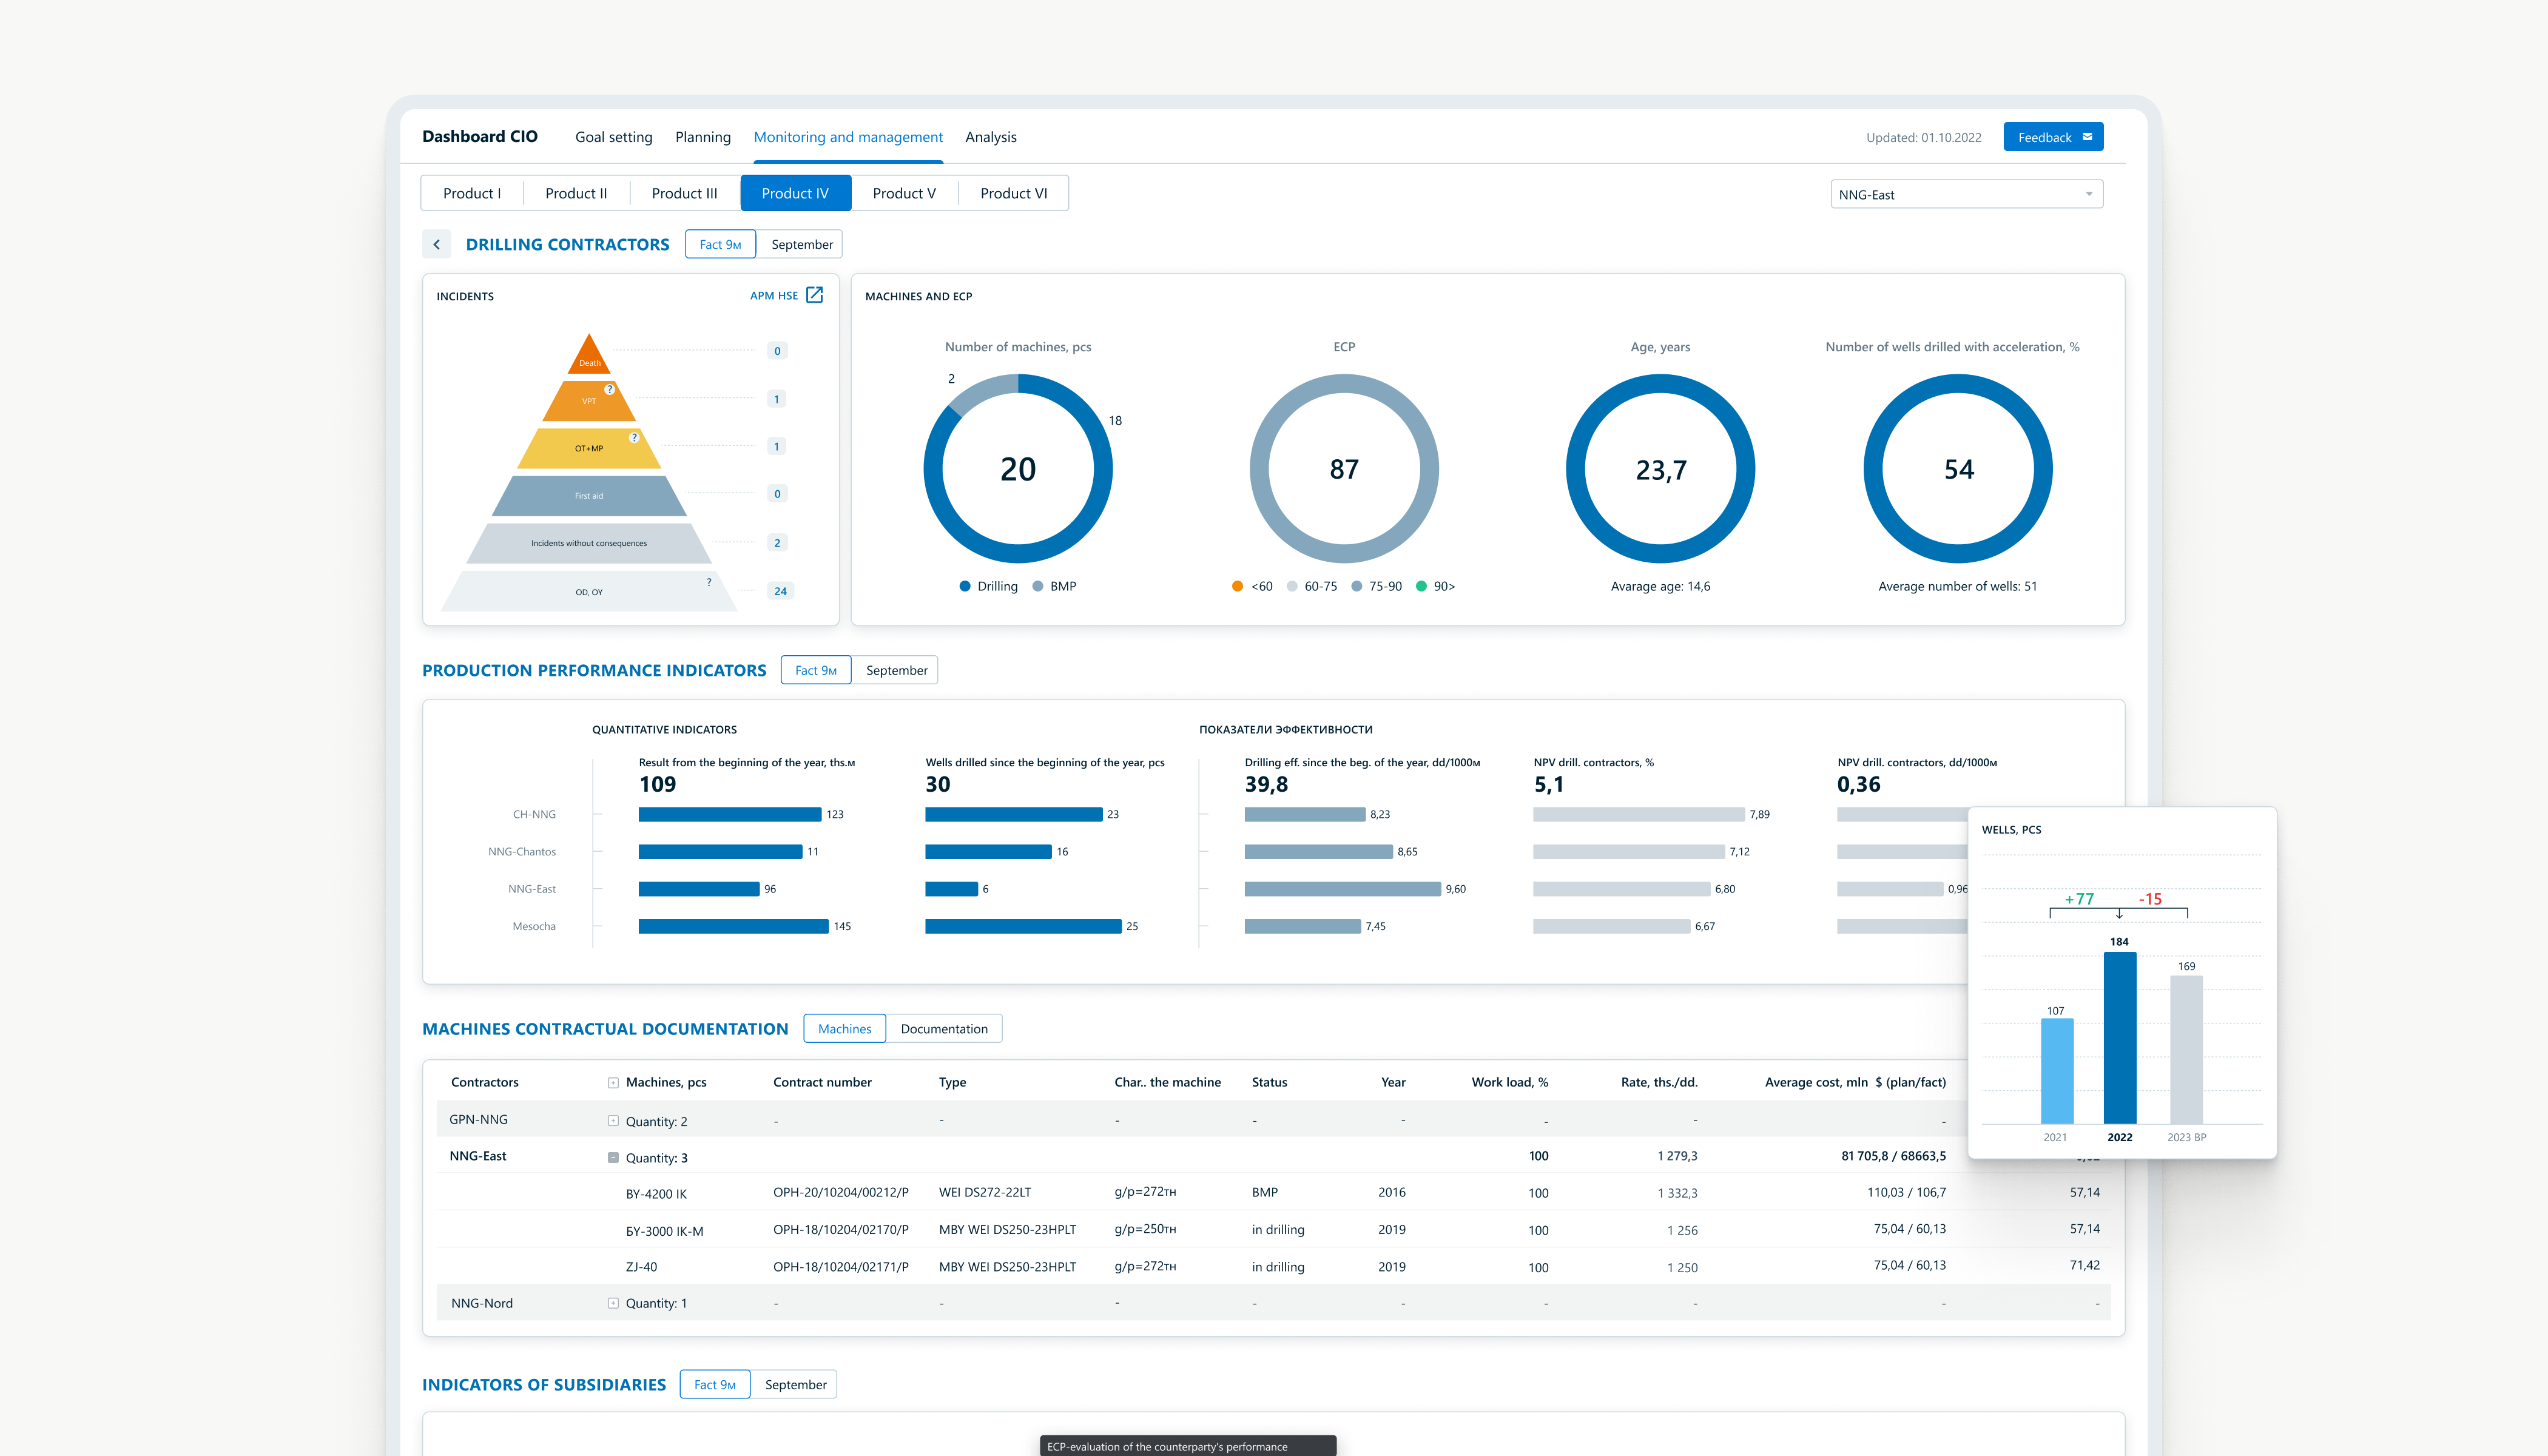
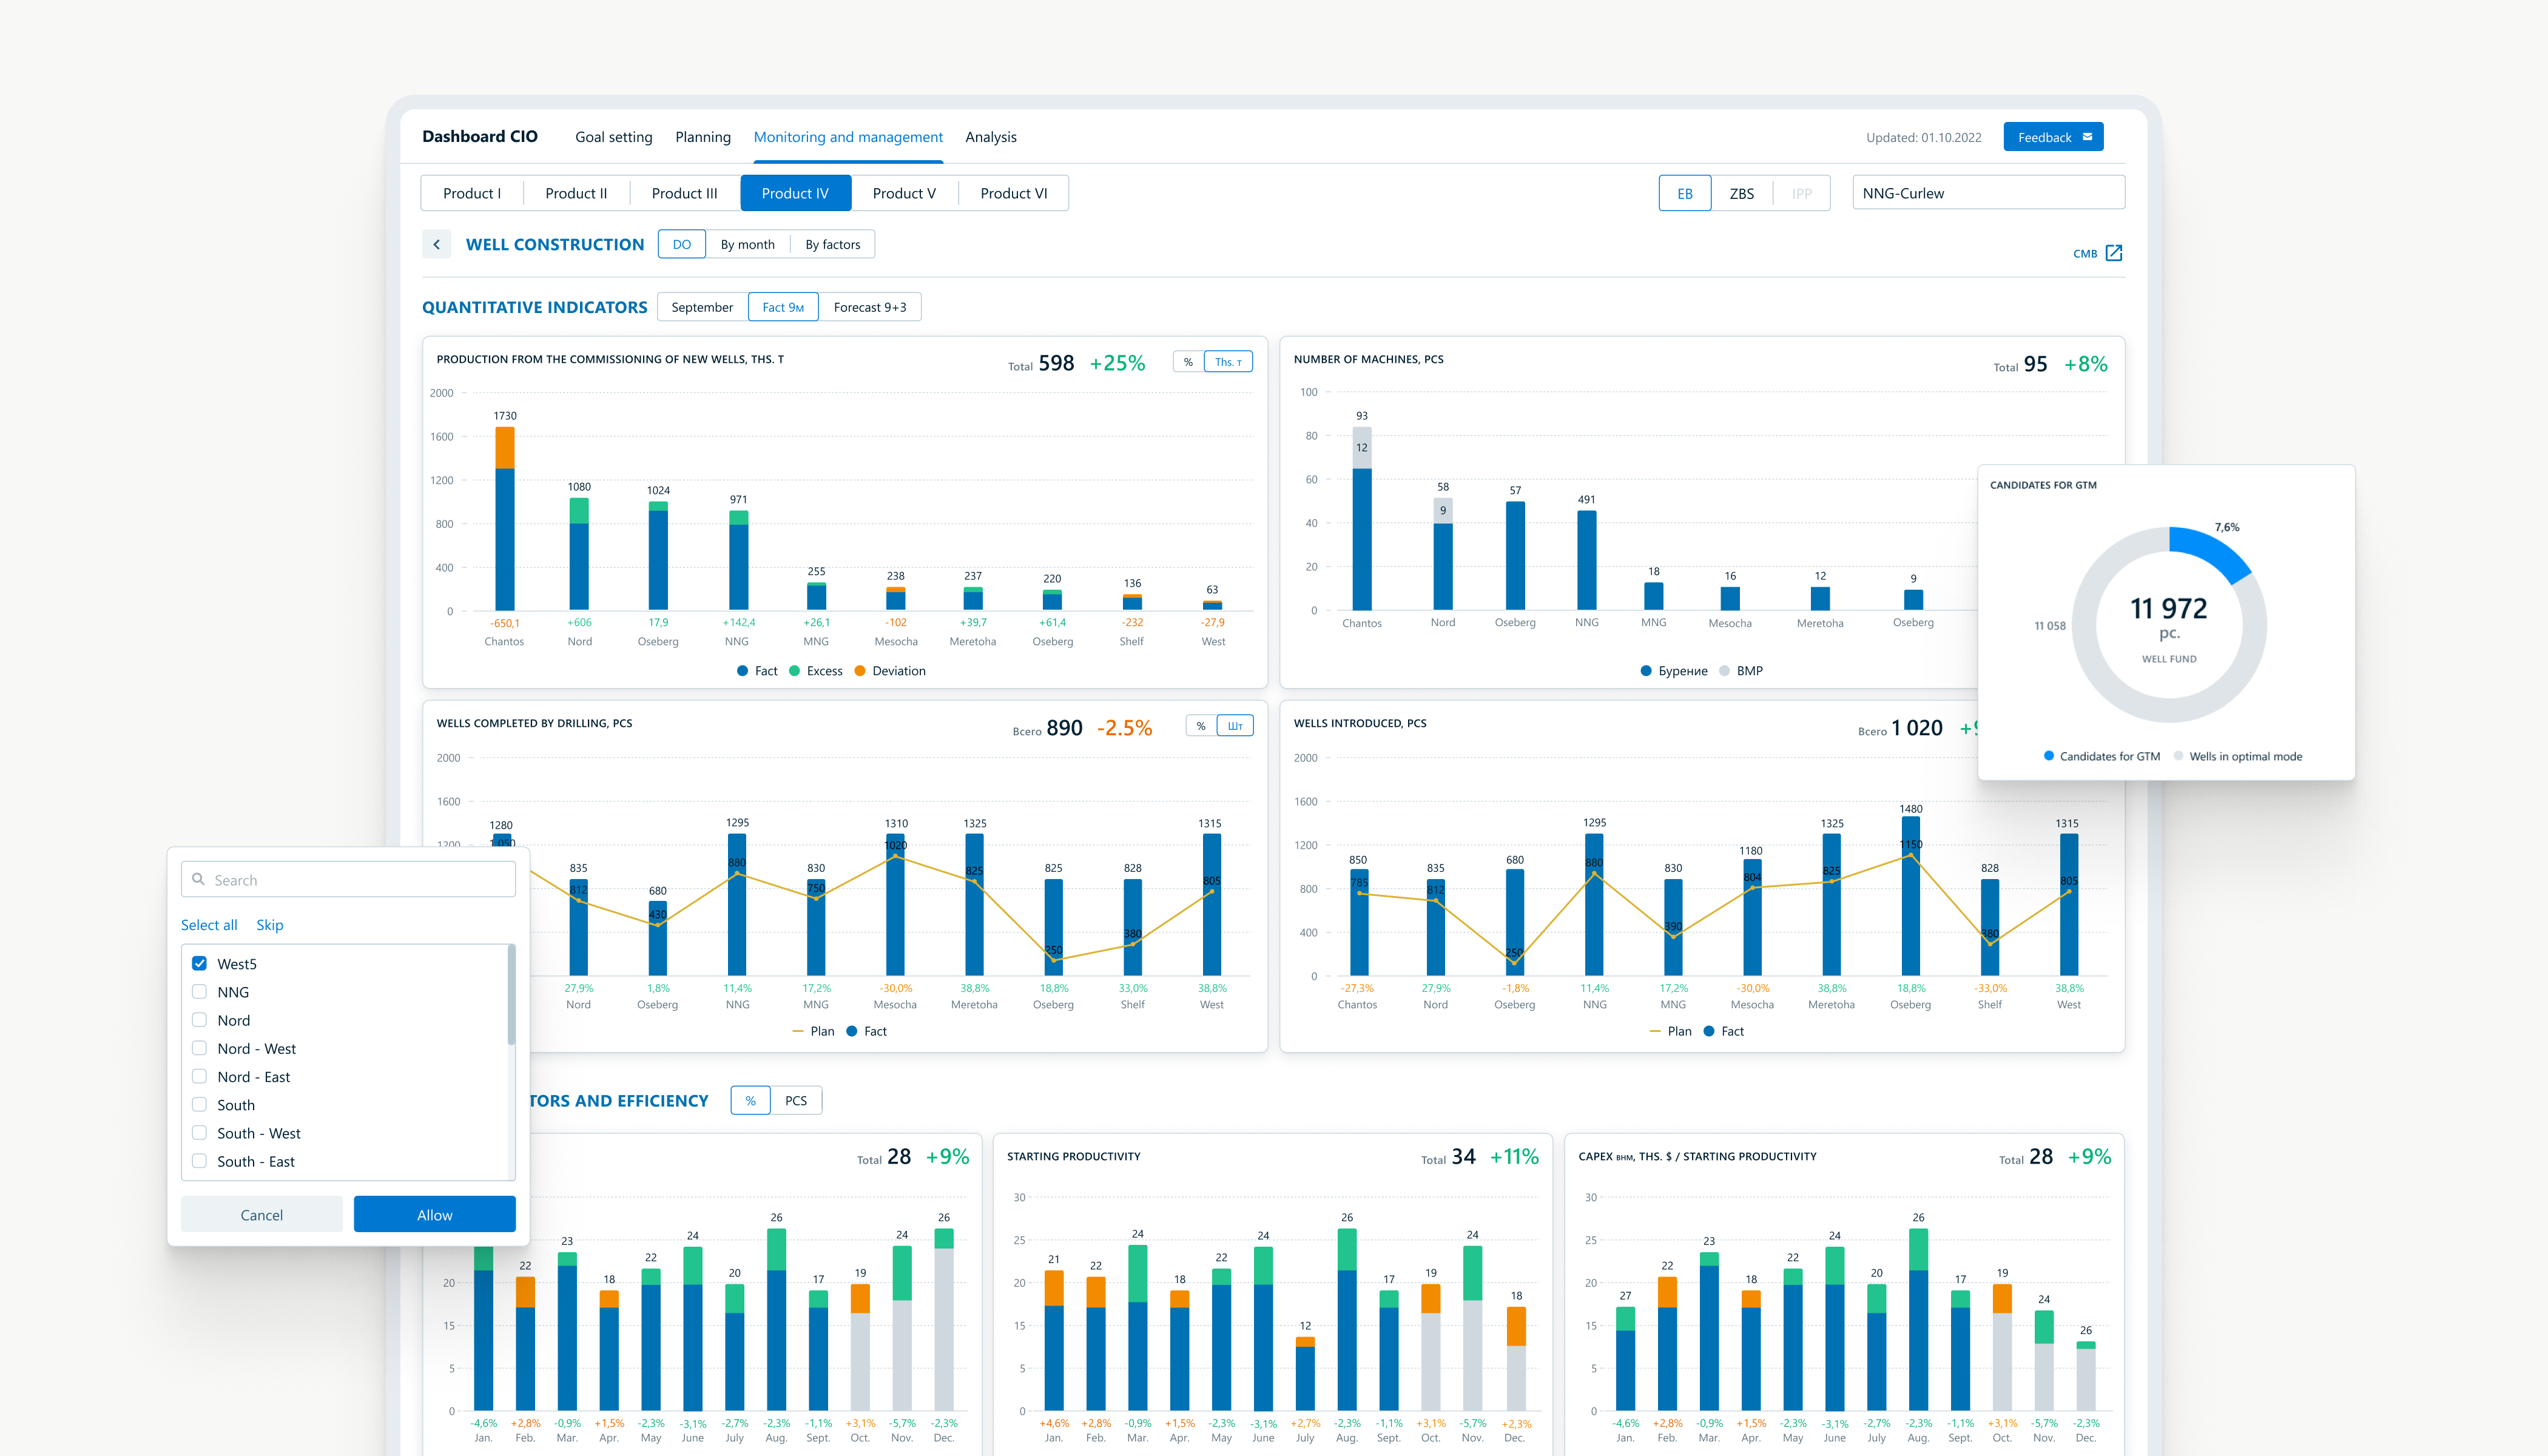
The system had to process large volumes of real-time industrial data - dashboards, control tables, analytics modules, and visual monitoring tools - while remaining intuitive and navigable.
The primary objective was to deliver clarity and control without sacrificing performance or overwhelming the user. Ultimately, the platform needed to empower leadership with accurate, real-time insights to support faster, data-driven decision-making across operations.
Our Focus
We led the product design process from discovery to delivery - including stakeholder interviews, business analysis, UX architecture, and interface design. Our goal was to turn raw, multi-source operational data into a decision-ready product.
Each screen and component was carefully shaped around real business needs - not just to look good, but to improve visibility, streamline control, and enable confident action at every level.
Although development was handled by the client’s team, we delivered a complete, approved design system and supported their engineers to ensure consistency between product intent, UX logic, and implementation.
As shared by the client’s operational lead, helped leadership make faster decisions and rely less on scattered tools.

Key Features
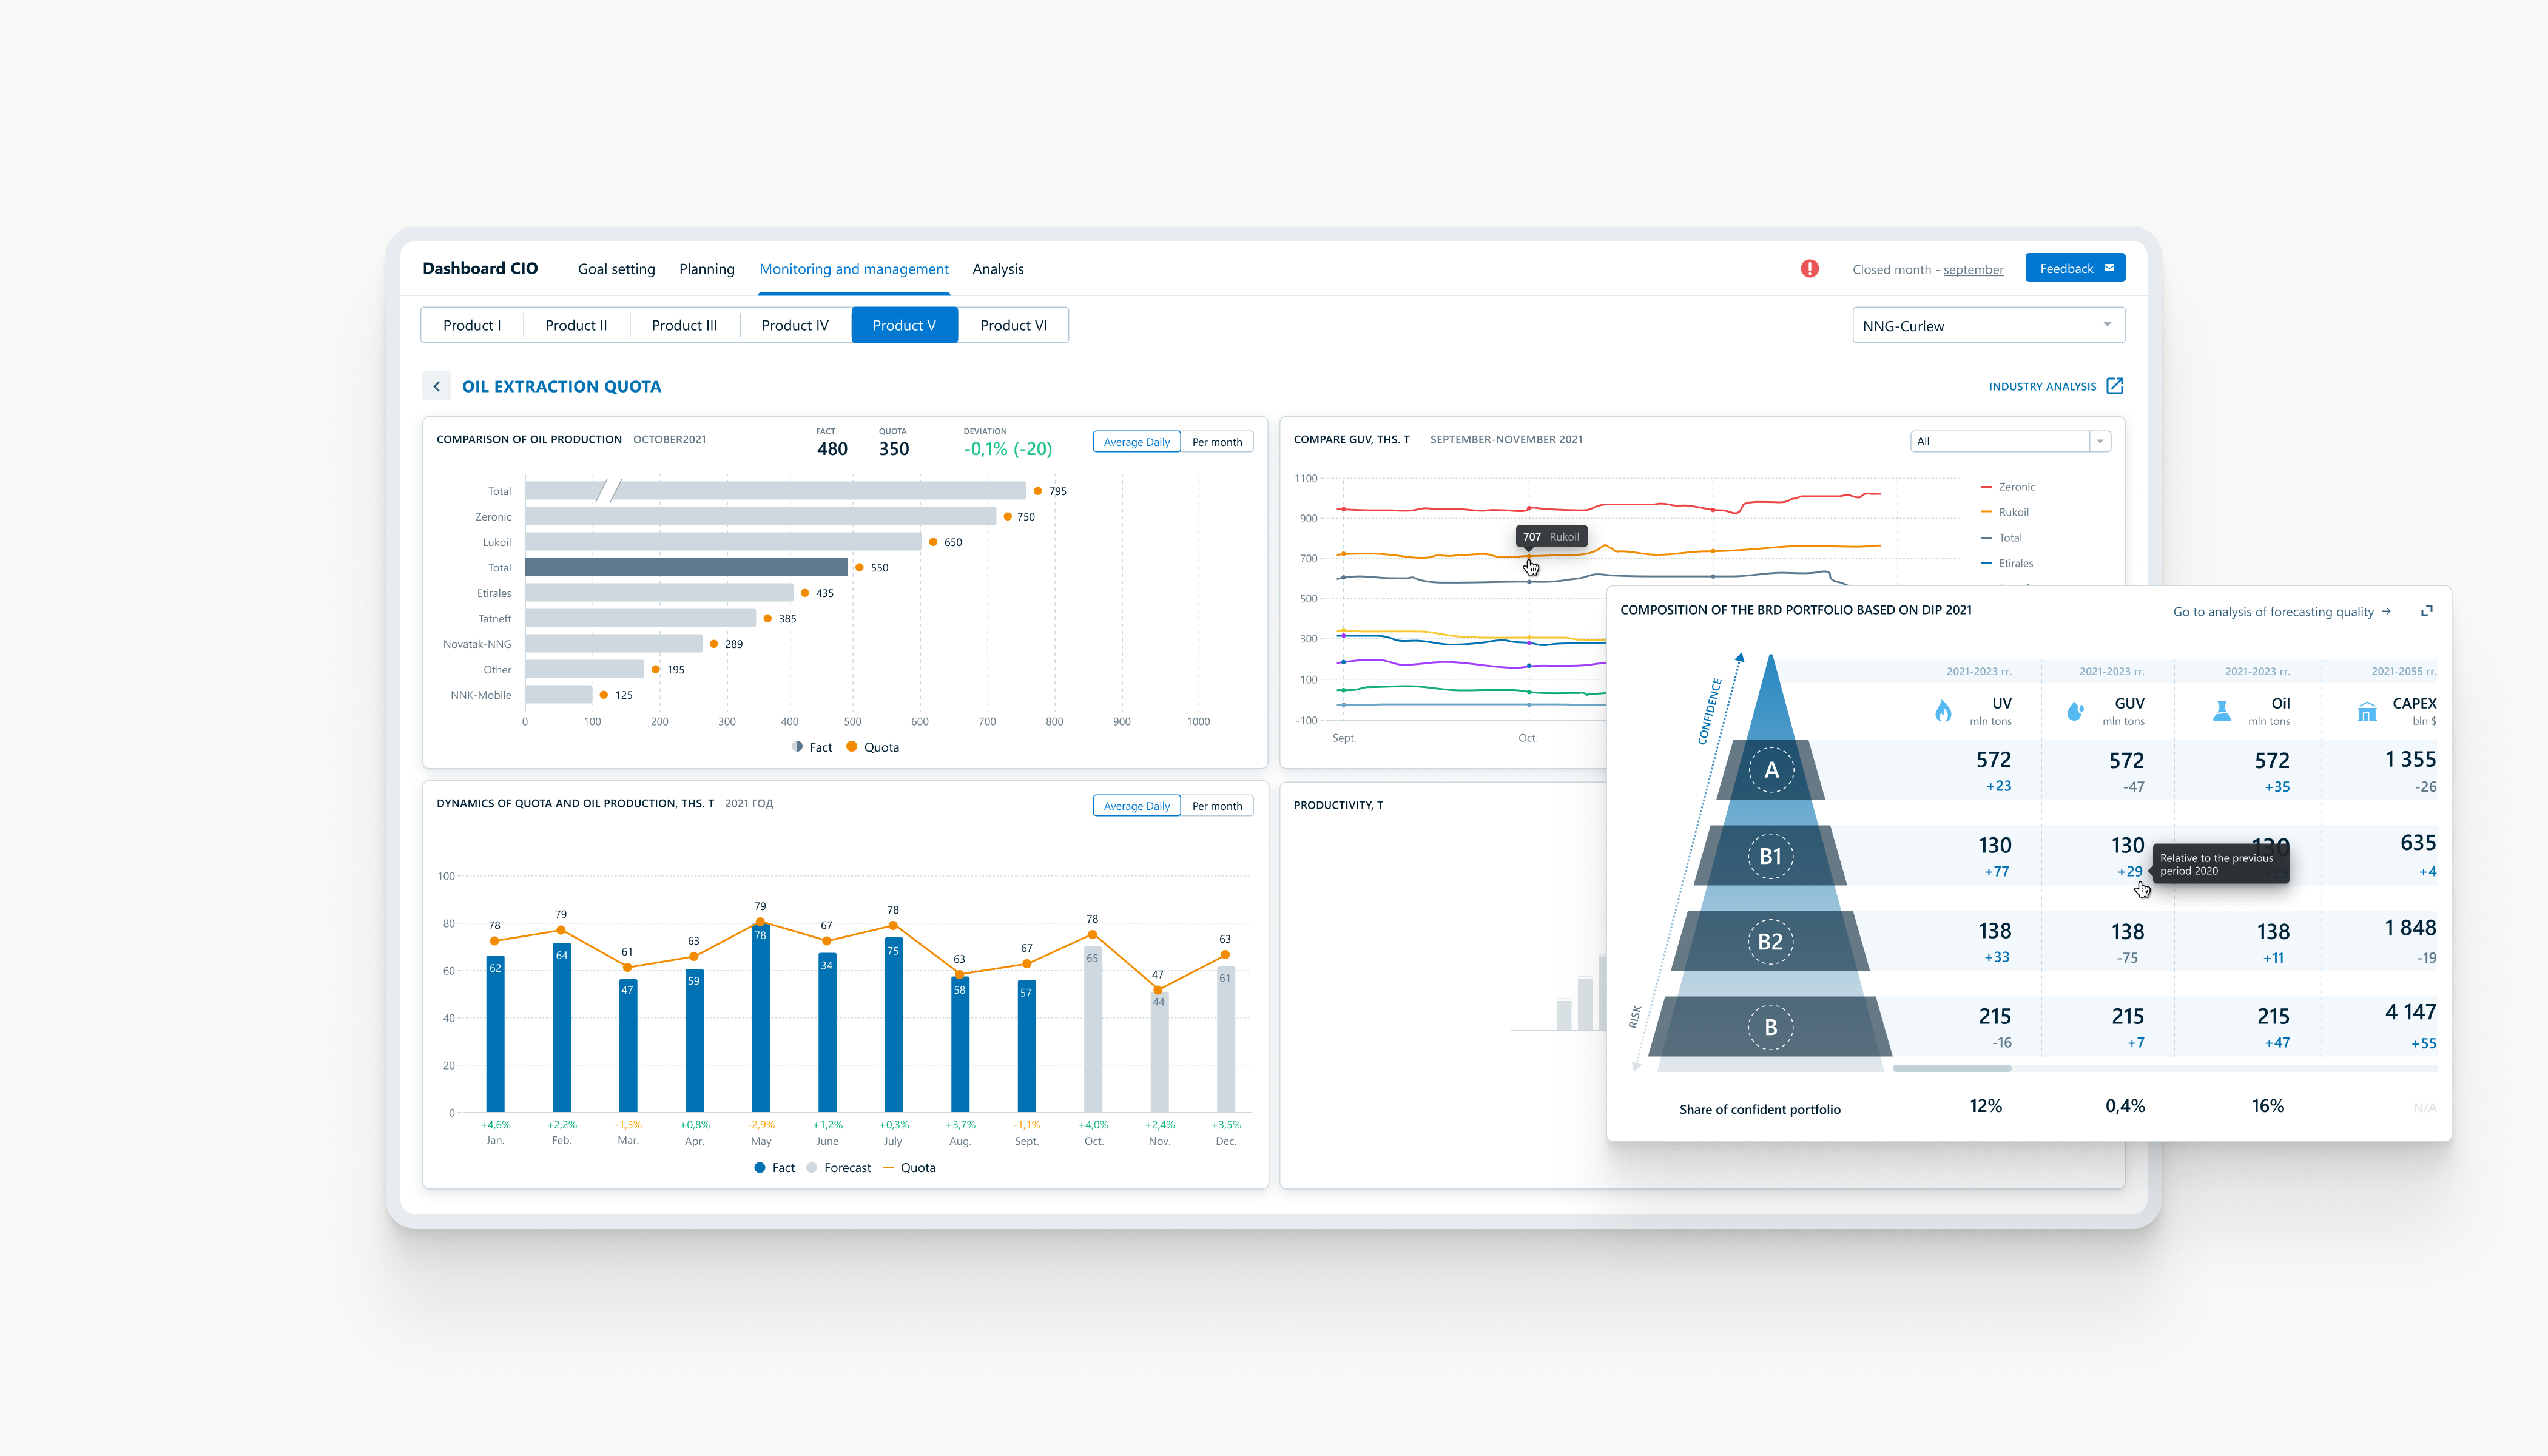
Real-time Data Monitoring
Live dashboards visualizing operational data from multiple sources - updated continuously for immediate awareness and response.
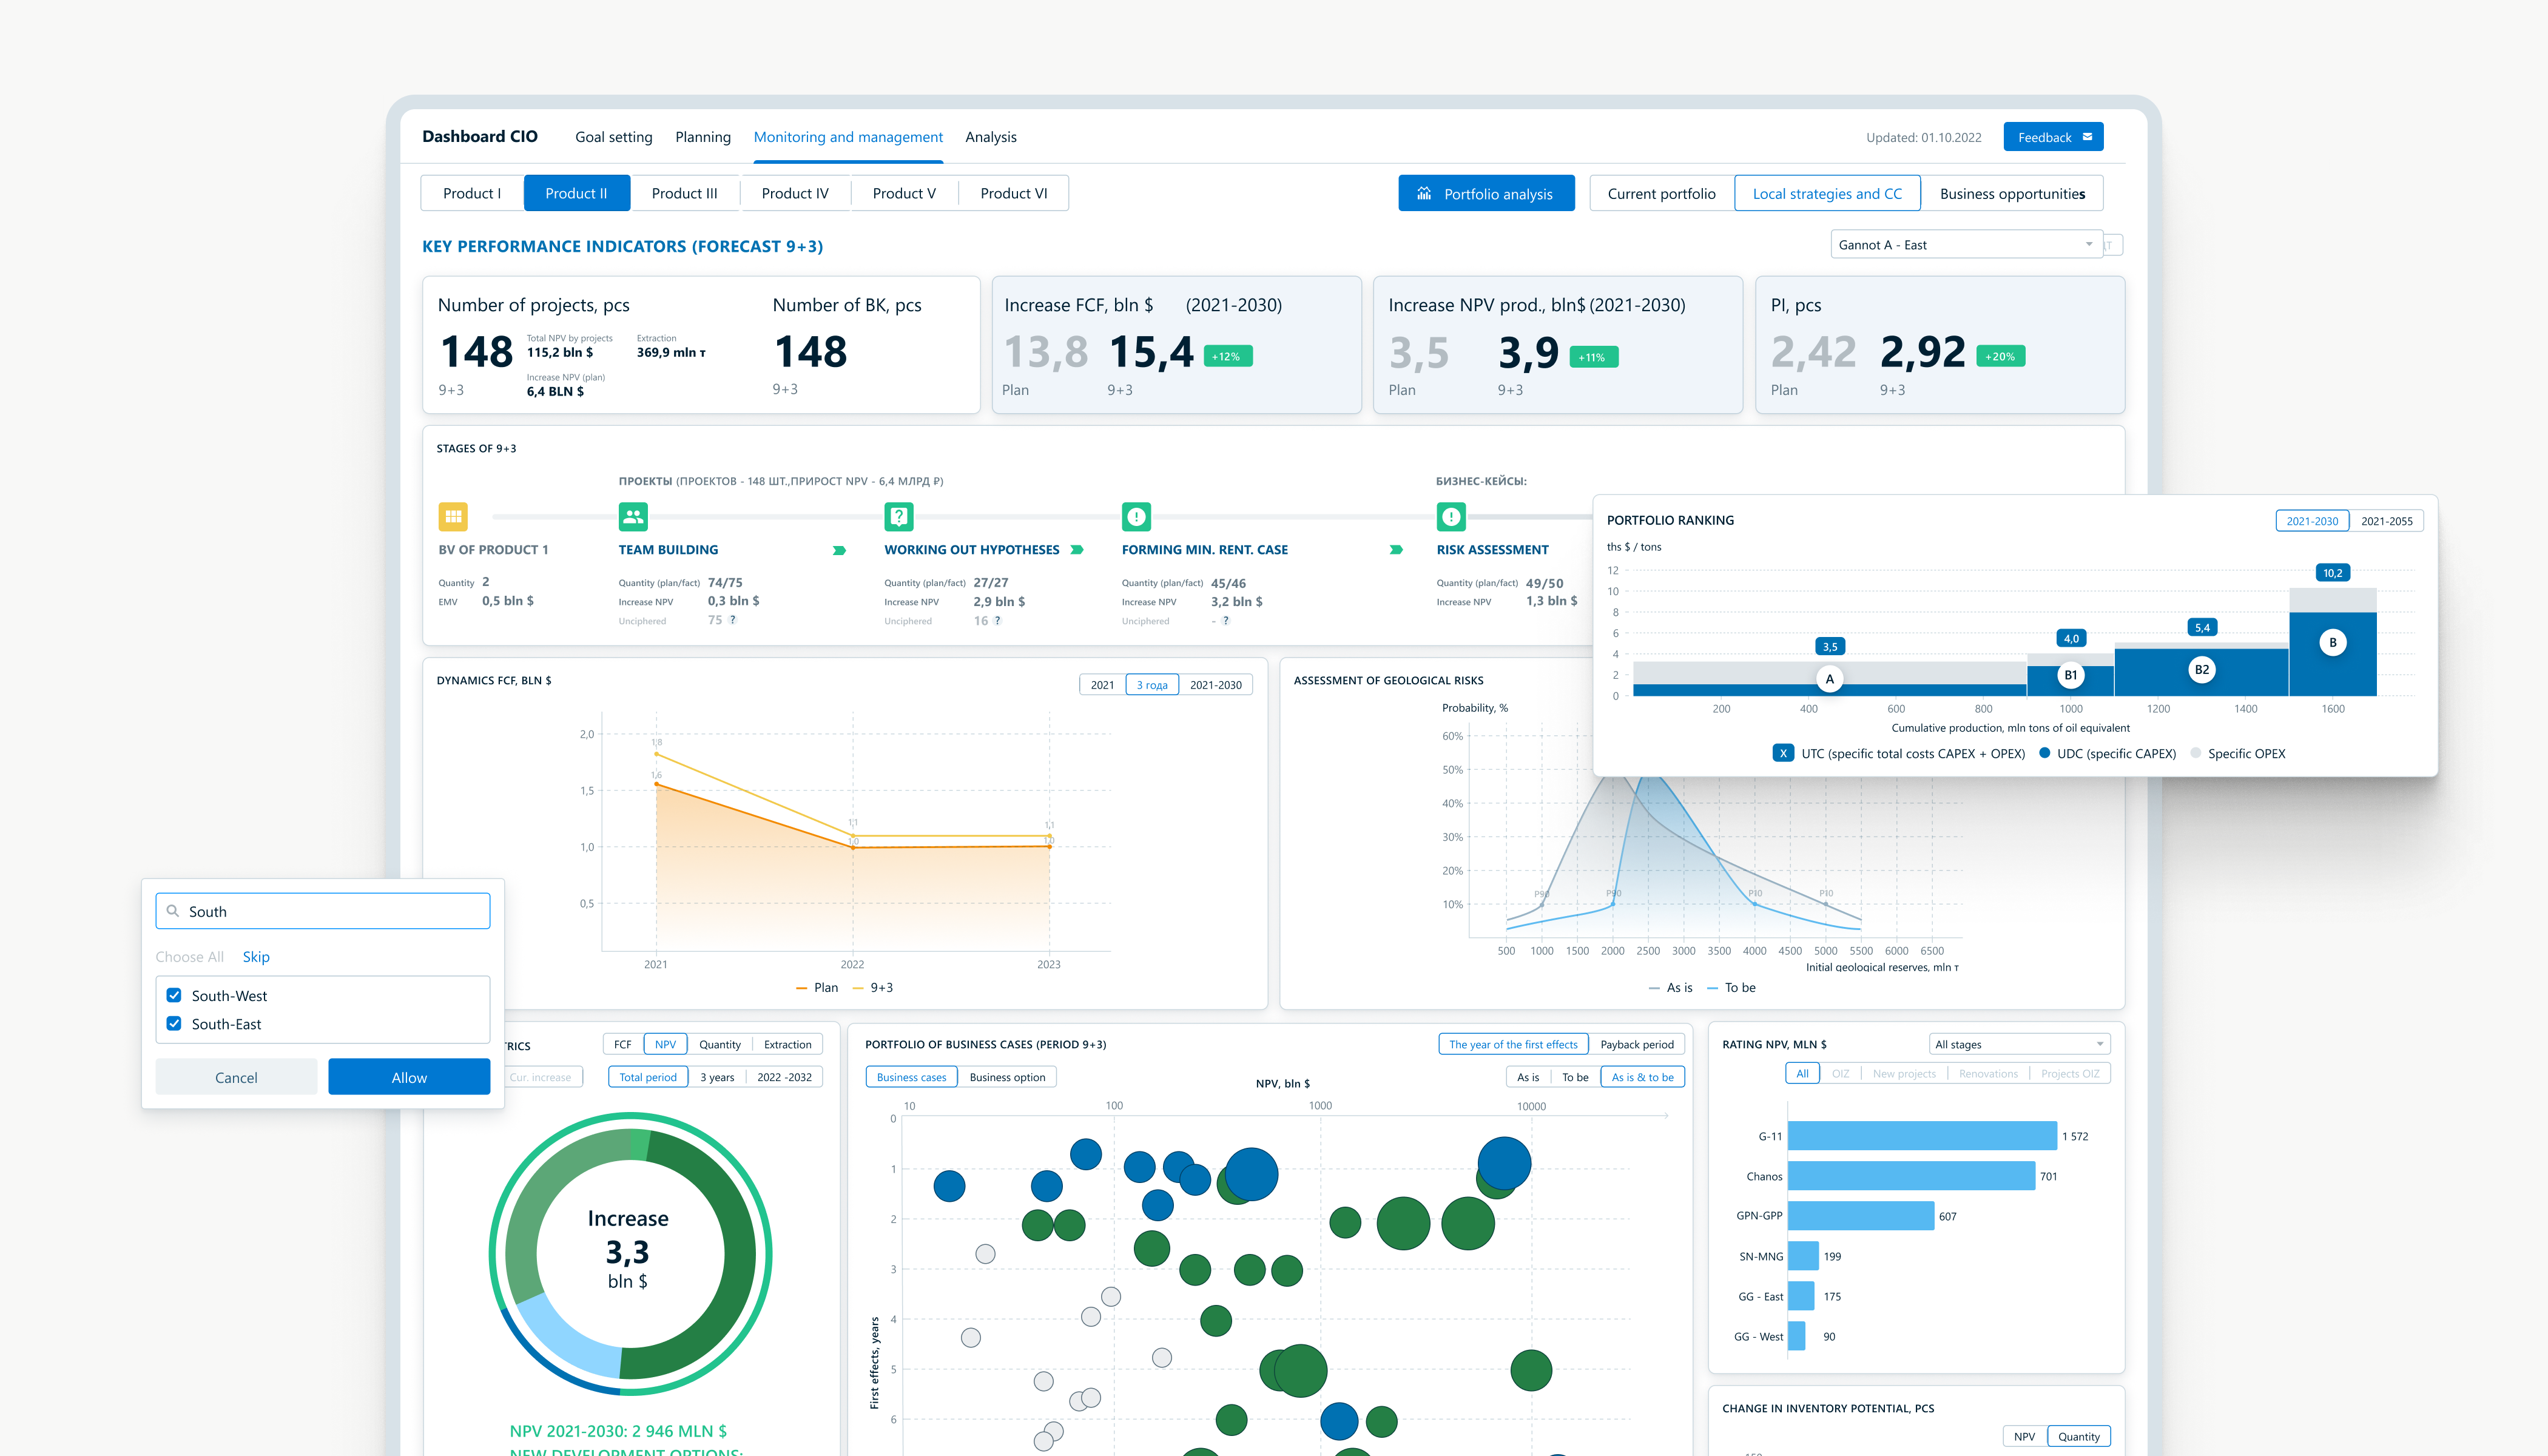
Modular Analytics Components
Flexible charts, tables, and filters designed for scale - allowing users to focus on specific assets, timeframes, or KPIs.
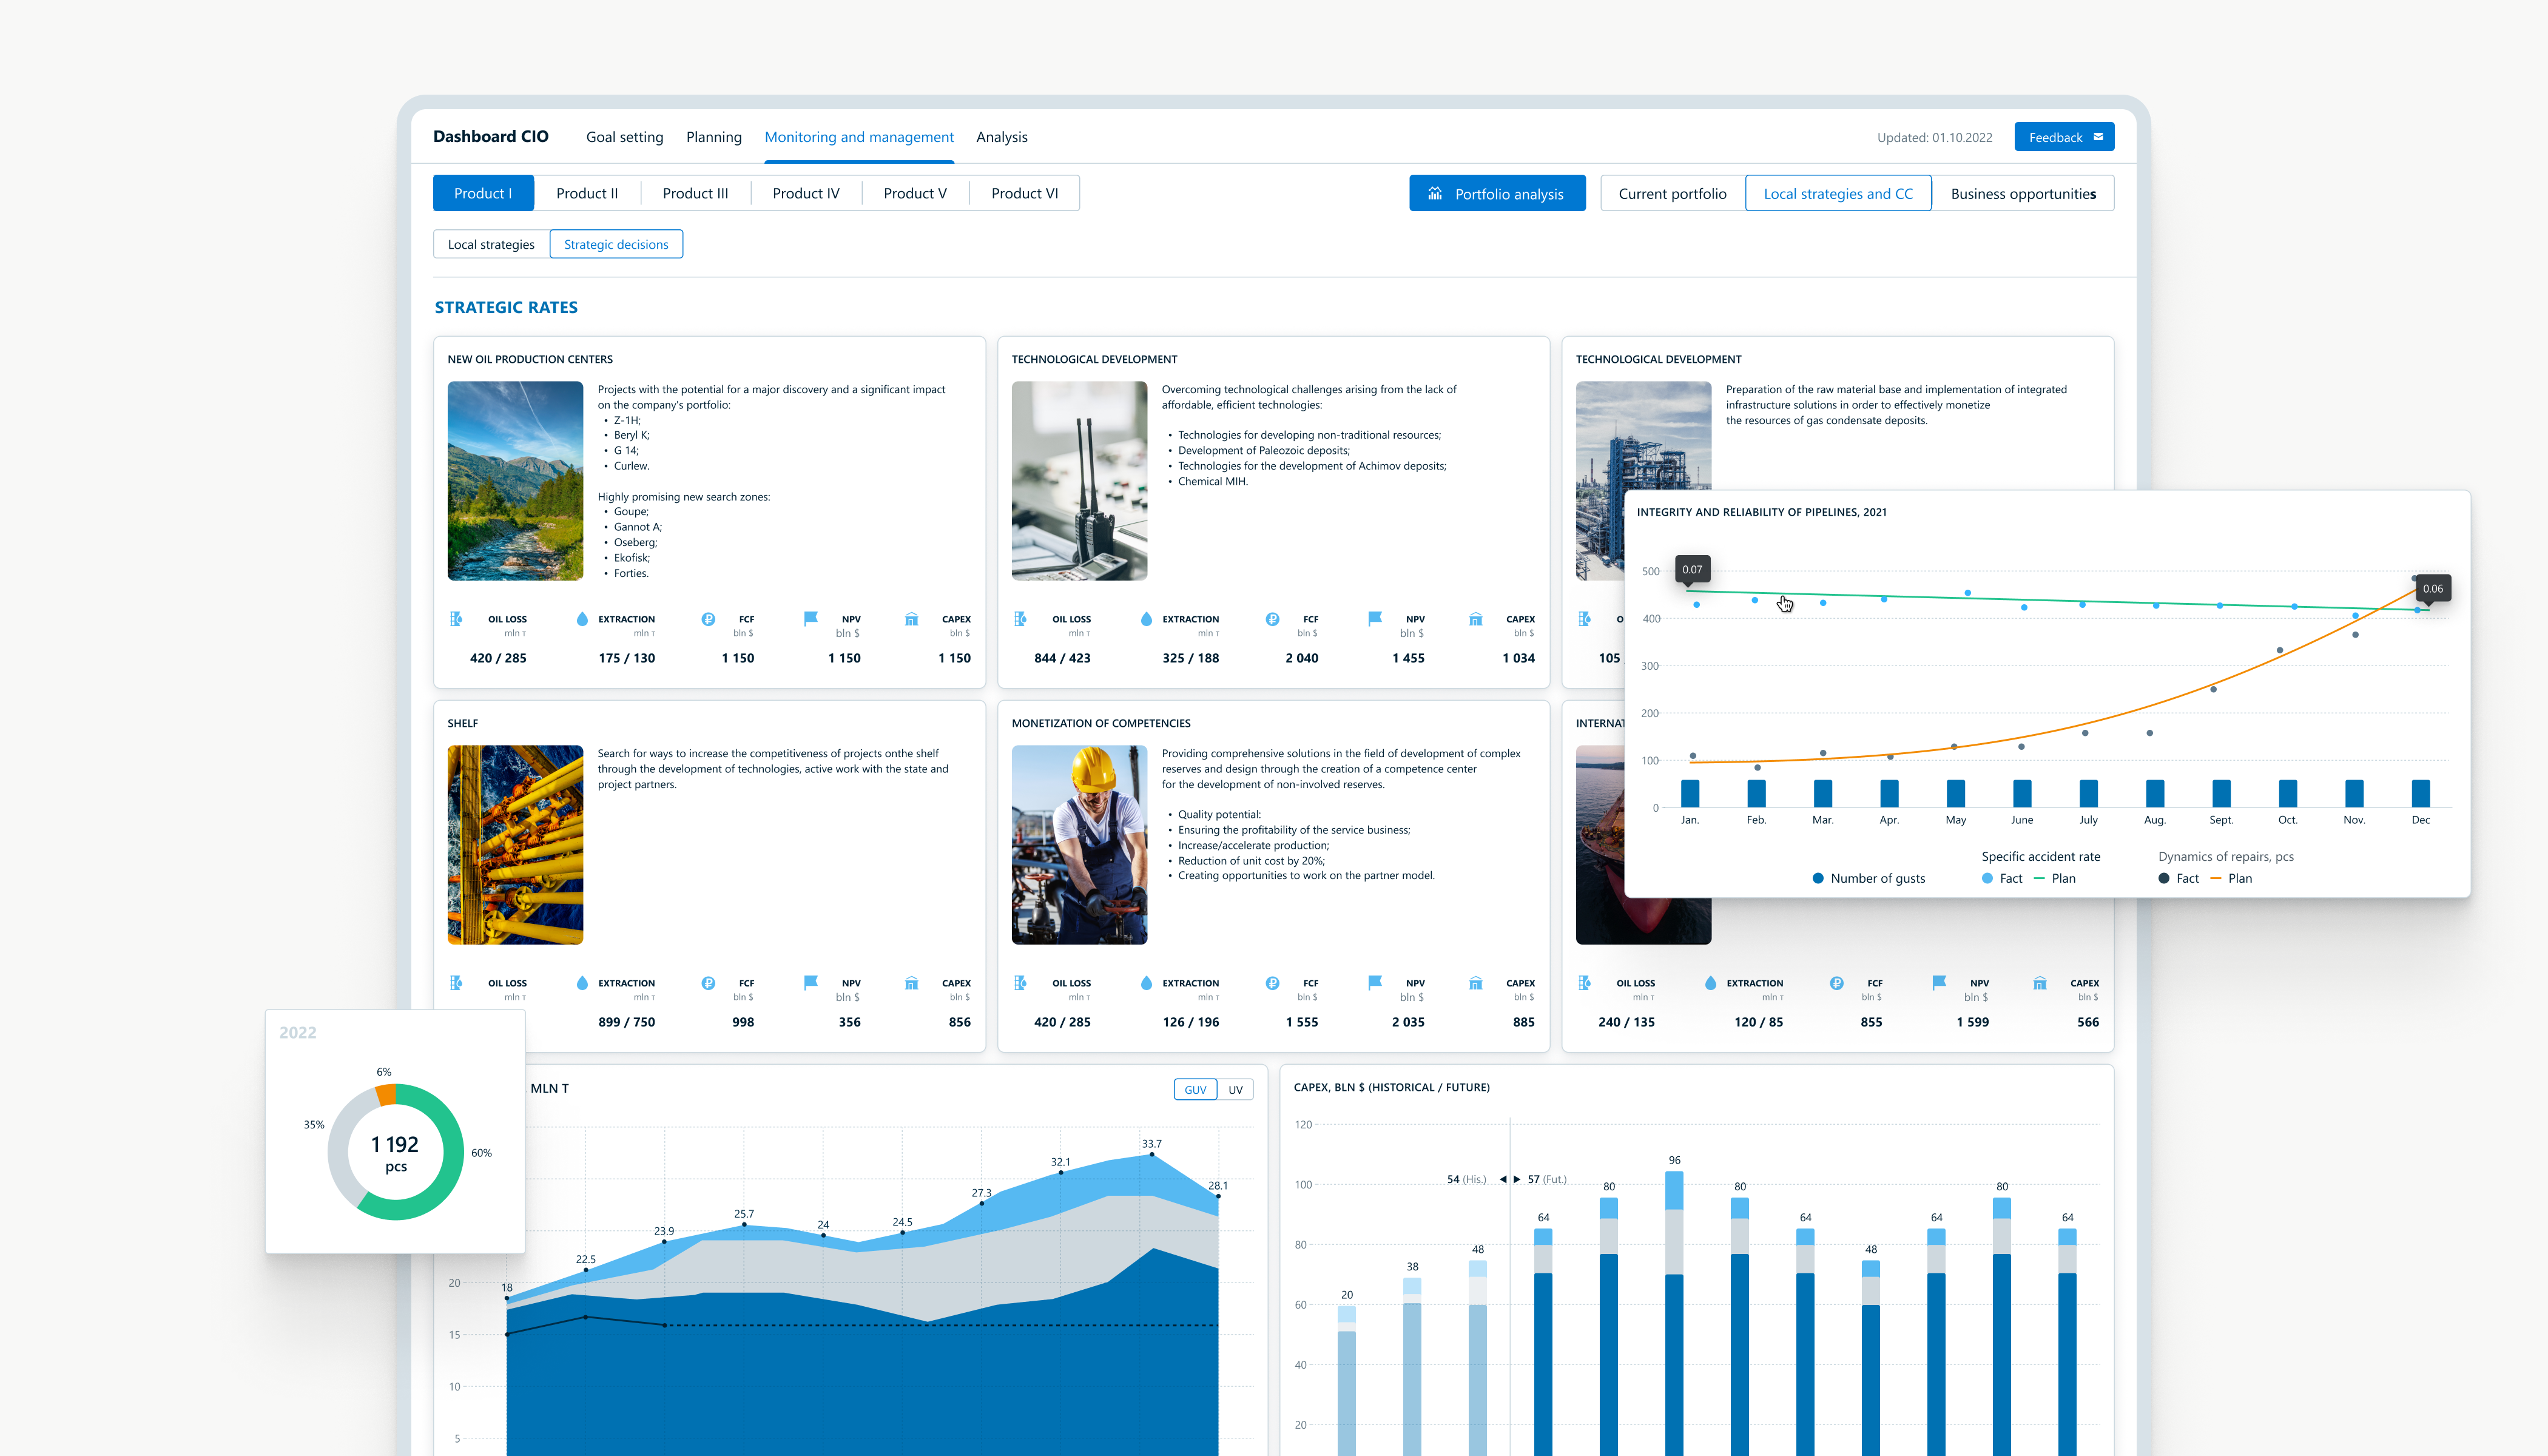
Role-based Data Views
Tailored interfaces for operators, analysts, and executives - ensuring each stakeholder sees the insights that matter to them.
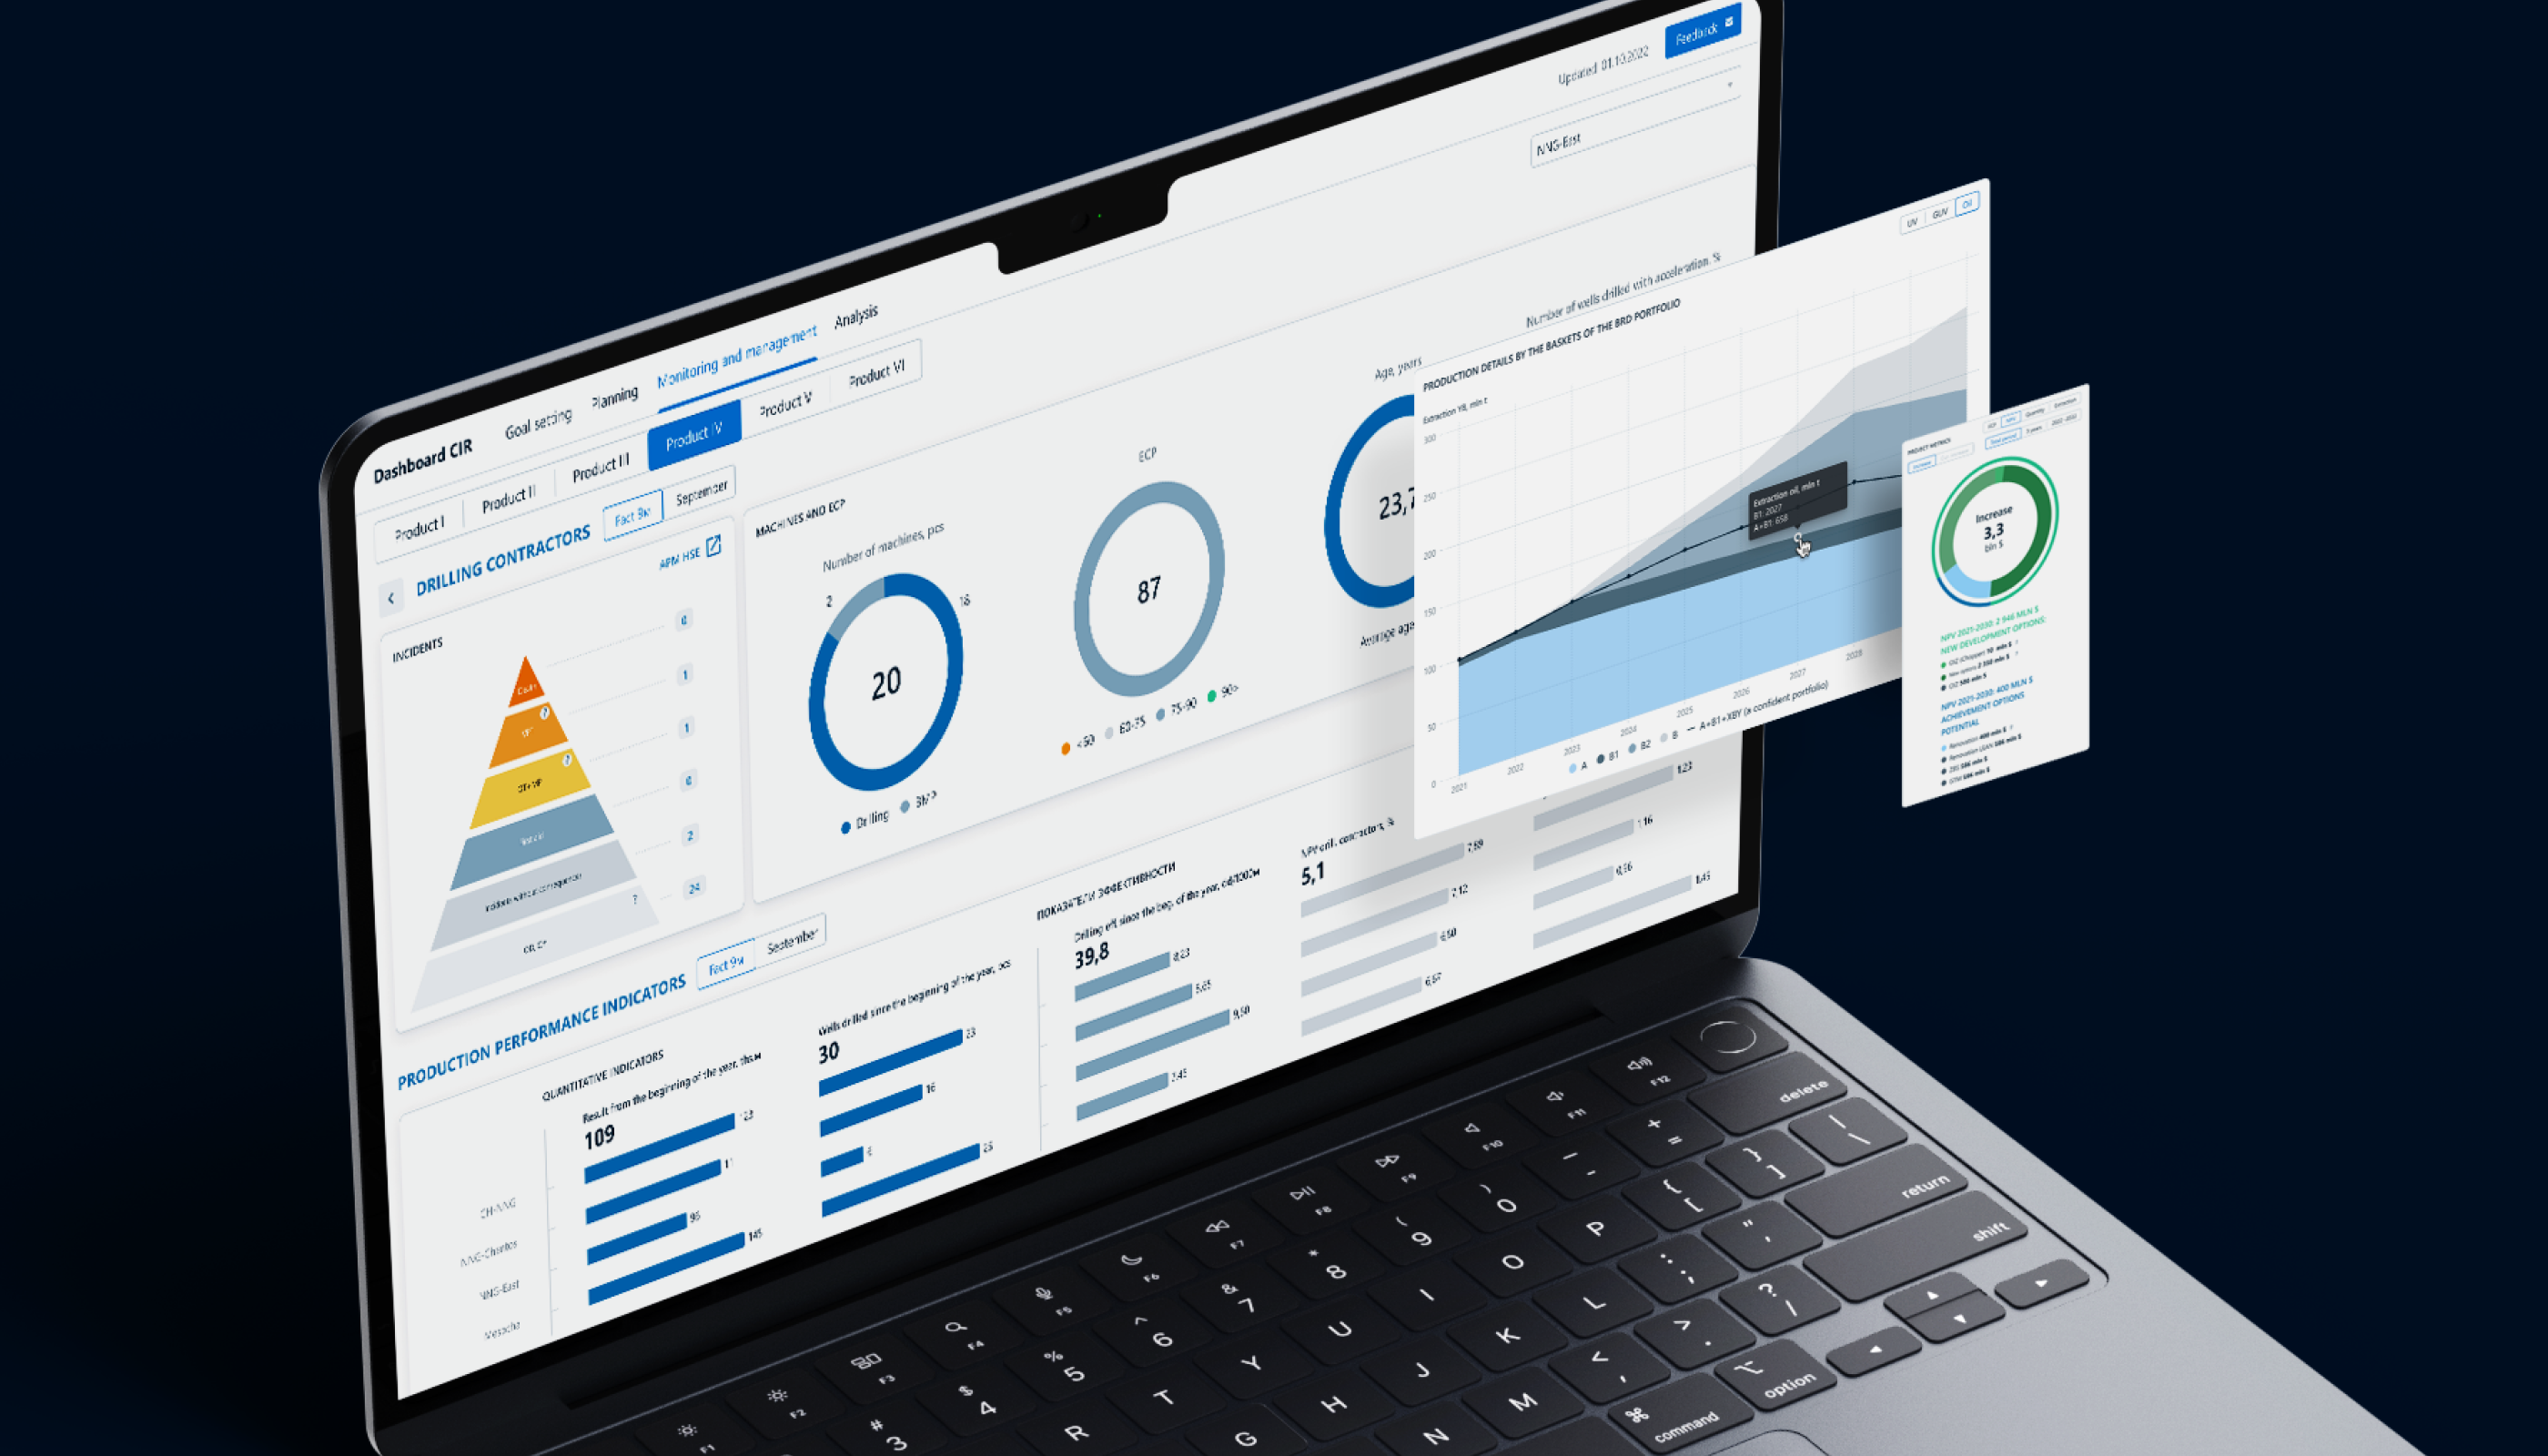
Visual Clarity at Scale
Clean design optimized for large-format screens in control rooms - balancing density with usability for high-stakes environments.
Strategic Reporting Layer
Custom views and trend visualizations designed to support leadership in long-term decision-making and scenario analysis.
Launch & Growth
With the design system fully delivered and implemented, the project moved into a launch phase across multiple departments. The platform now supports daily operations, real-time decision-making, and strategic reporting at scale.
Next, we helped shape a roadmap for growth - including advanced analytics, predictive features, and future integrations to support evolving needs and higher data complexity.
While engineering was handled by the client’s team, we delivered a developer-friendly system with clear structure, reusable components, and responsive layouts - enabling a smooth handoff and accurate implementation.
Impact Summary
• 18× fewer decision-making errors
Validated by internal analytics after streamlining strategic workflows.
• 3× improvement in production outcomes
Thanks to real-time insights and system-wide data alignment.
• Cross-department coordination unlocked
Role-based flows helped unify daily operations and reduce friction.
• One system. Zero fragmentation
Legacy tools and scattered dashboards replaced by a unified BI platform.
These outcomes were validated by client-side operations and analytics teams.